Robot Monitor

  • Comprehensive performance monitoring software for IBM i, VIOS, AIX, Linux on Power

Robot Monitor

Robot Monitor

Robot Monitor gives you absolute visibility against exceptional conditions in the system, helps keep you informed with real-time alerts and simplifies in-depth analysis of details, to resolve performance issues. With Robot Monitor, there is no place for downtime.

Comprehensive Performance Monitoring:

Robot Monitor is the most comprehensive, in-depth monitoring solution available for Power Systems environments running IBM i alone or alongside VIOS, AIX, or Linux on Power. Industry-leading technology gives you the highest degree of monitoring for your critical IT infrastructure.

Maximum Uptime:

By monitoring the performance of your Power servers in real time—including system status, disk, network, availability, application data, and JDBC/ODBC activity—you and your team can proactively respond to issues before they impact user productivity or resources.
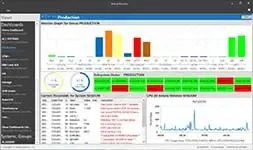
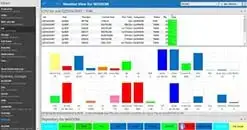
Modern Dashboards:

Highly customizable, modern dashboards provide visibility into all your metrics, elements, and status conditions so you don’t miss a thing. See all your data from a single, central interface to avoid downtime and optimize performance. Not watching the dashboard? Robot Monitor can send out notification when things go wrong.

The proactive results and efficiency we were able to achieve, even in the evaluation period, convinced us to buy this software—we can see every day that this was a good idea.

Lutz Piller
Head of IT
PRETTL Electronics

Key Application and Performance Monitoring Features:

Robot_Monitor_Funcionalidad1
Get centralized visibility and control of your IBM i environment from a single graphical interface. Display any combination of system metrics, status conditions, and workloads. Customize your view to display what’s important to your unique needs.
Robot_Monitor_Funcionalidad2
Empower your team with individually tailored views displaying the specific metrics each technician must monitor. Combine views across multiple systems in your network so NOC managers can get the bigger picture—even integrate exceptions into a single list and prioritize using red/yellow/green color-coding.
Robot_Monitor_Funcionalidad3
If your temporary storage or disk is escalating, reduce the time it takes to pinpoint the root cause. Instantly drill down to show all the jobs consuming CPU, temporary storage, QTEMP, I/O, transactions, faulting rates, and other metrics, for faster problem resolution.
Robot_Monitor_Funcionalidad4
Keep an eye on key metrics that indicate the health of your Virtual I/O Server (VIOS)—including physical adapter status, throughput, processor, disk, memory, and the error log (errpt)—so you can more easily identify strain points and reallocate or add resources before bottlenecks degrade system and application performance.
Robot_Monitor_Funcionalidad5
SQL-based monitoring technology provides a near-unlimited selection of monitoring options, giving you the insight you need into business application data, such as the number of open problems, customer orders, or stock replenishment figures.
Robot_Monitor_Funcionalidad6
Regular reporting is part of your job, but it doesn’t have to be tedious. Make reporting a simple, automated task with graphical reports that are easy for non-technical colleagues to interpret. Share reports via email to a list of defined recipients or to a server.

Monitor Virtually Anything

Cover your critical infrastructure with confidence. If you need a deep, comprehensive view of the health of your Power server running IBM i, Robot Monitor delivers real-time performance data on:

  • Jobs, jobqs, outq, and subsystems

  • System configuration

  • JDBC/ODBC/SQL performance

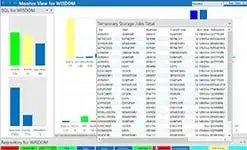
  • Disk storage utilization

  • Communication performance

  • Virtual I/O Server (VIOS)

  • Memory, temp storage, and QTEMP

  • Journal status and size

  • Business-critical applications, including Robot HA, PowerHA, MIMIX, BRMS, and IBM MQ

  • AIX and Linux on Power

Reference Material

Information (Web Site)

Note 1: Some of the content (images and texts) used in this page are property of Fortra